Project notes
Log Management System - Phase 2: Implementation & Tool Configuration
Step-by-step installation and connecting log sources to each of the four candidate tools.
Overview
This is Part 2 of the LMS evaluation series. Part 1 covered the requirements, tool candidates, and evaluation framework. This post covers the actual installation — getting all four platforms running on real hardware and verifying that each one could receive logs from our sources.
The milestone for Phase 2 was simple: logs received. No analysis, no alerting, no dashboards yet — just confirming that the full pipeline from log source to storage was working for each tool.
Test Environment
Before touching any installer, we documented the four servers allocated for this PoC. Two tools per pair of machines, different specs per role.
Server 1 runs Debian 11 (Bullseye). It’s the beefier of the two Debian machines — 2 TB disk with LVM layout, 7.8 GB RAM. This became the host for ManageEngine ELA, which has the steepest hardware requirements of the four.
Server 2 runs Ubuntu 22.04 LTS. 100 GB disk, 15 GB RAM. The Ubuntu machine was used for Graylog — it has enough RAM to comfortably run OpenSearch alongside MongoDB and the Graylog server itself.
Server 3 runs Debian 12 (Bookworm). 150 GB disk, 15 GB RAM, and notably the most memory pressure at idle — already sitting at 9.8 GB used before we installed anything. This became the ELK Stack host.
Server 4 runs Debian 12 (Bookworm) as well, but lighter — 7.9 GB RAM, 200 GB disk. This hosted Grafana Loki, which is the lightest of the four in terms of resource footprint.
All servers run LVM-backed root volumes. No swap activity on Server 2, meaningful swap pressure on Server 1 and Server 3 from the start.
Installation
ManageEngine EventLog Analyzer
ELA ships as a single .bin installer. Download it from ManageEngine’s site, drop it on the server, make it executable, and run it.
cp /home/[user]/ManageEngine_EventlogAnalyzer.bin ManageEngine/
cd ManageEngine/
chmod +x ManageEngine_EventlogAnalyzer.bin
./ManageEngine_EventlogAnalyzer.bin
Since we’re on a headless VM, the graphical installer isn’t supported — it falls back to console mode automatically.
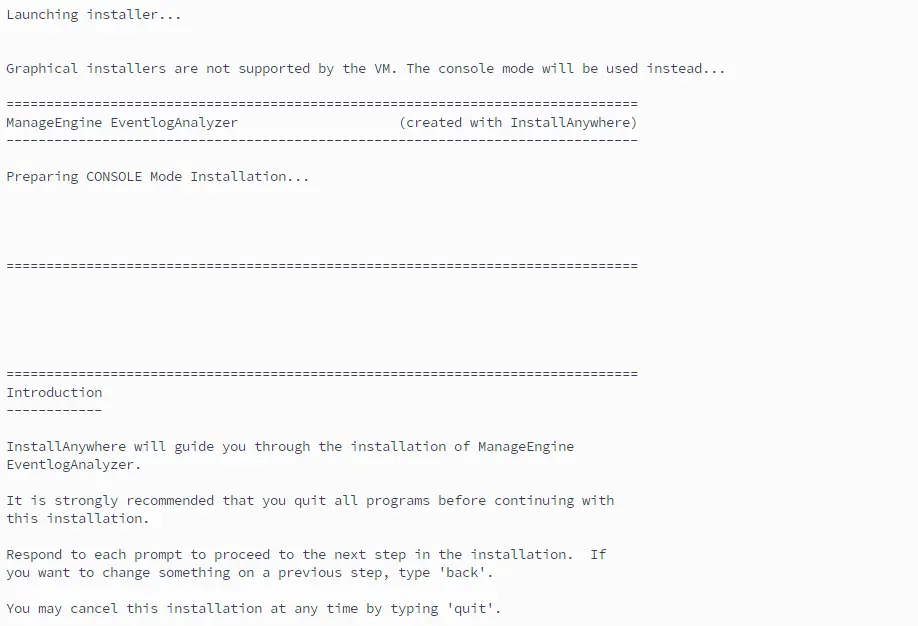
Accept the license, let it finish, then navigate to the install directory and register it as a systemd service:
/opt/ManageEngine/EventLog/bin/configureAsService.sh -sAfter that, ELA is available on port 8095. The dashboard loads empty — no devices configured yet, but the platform is running.
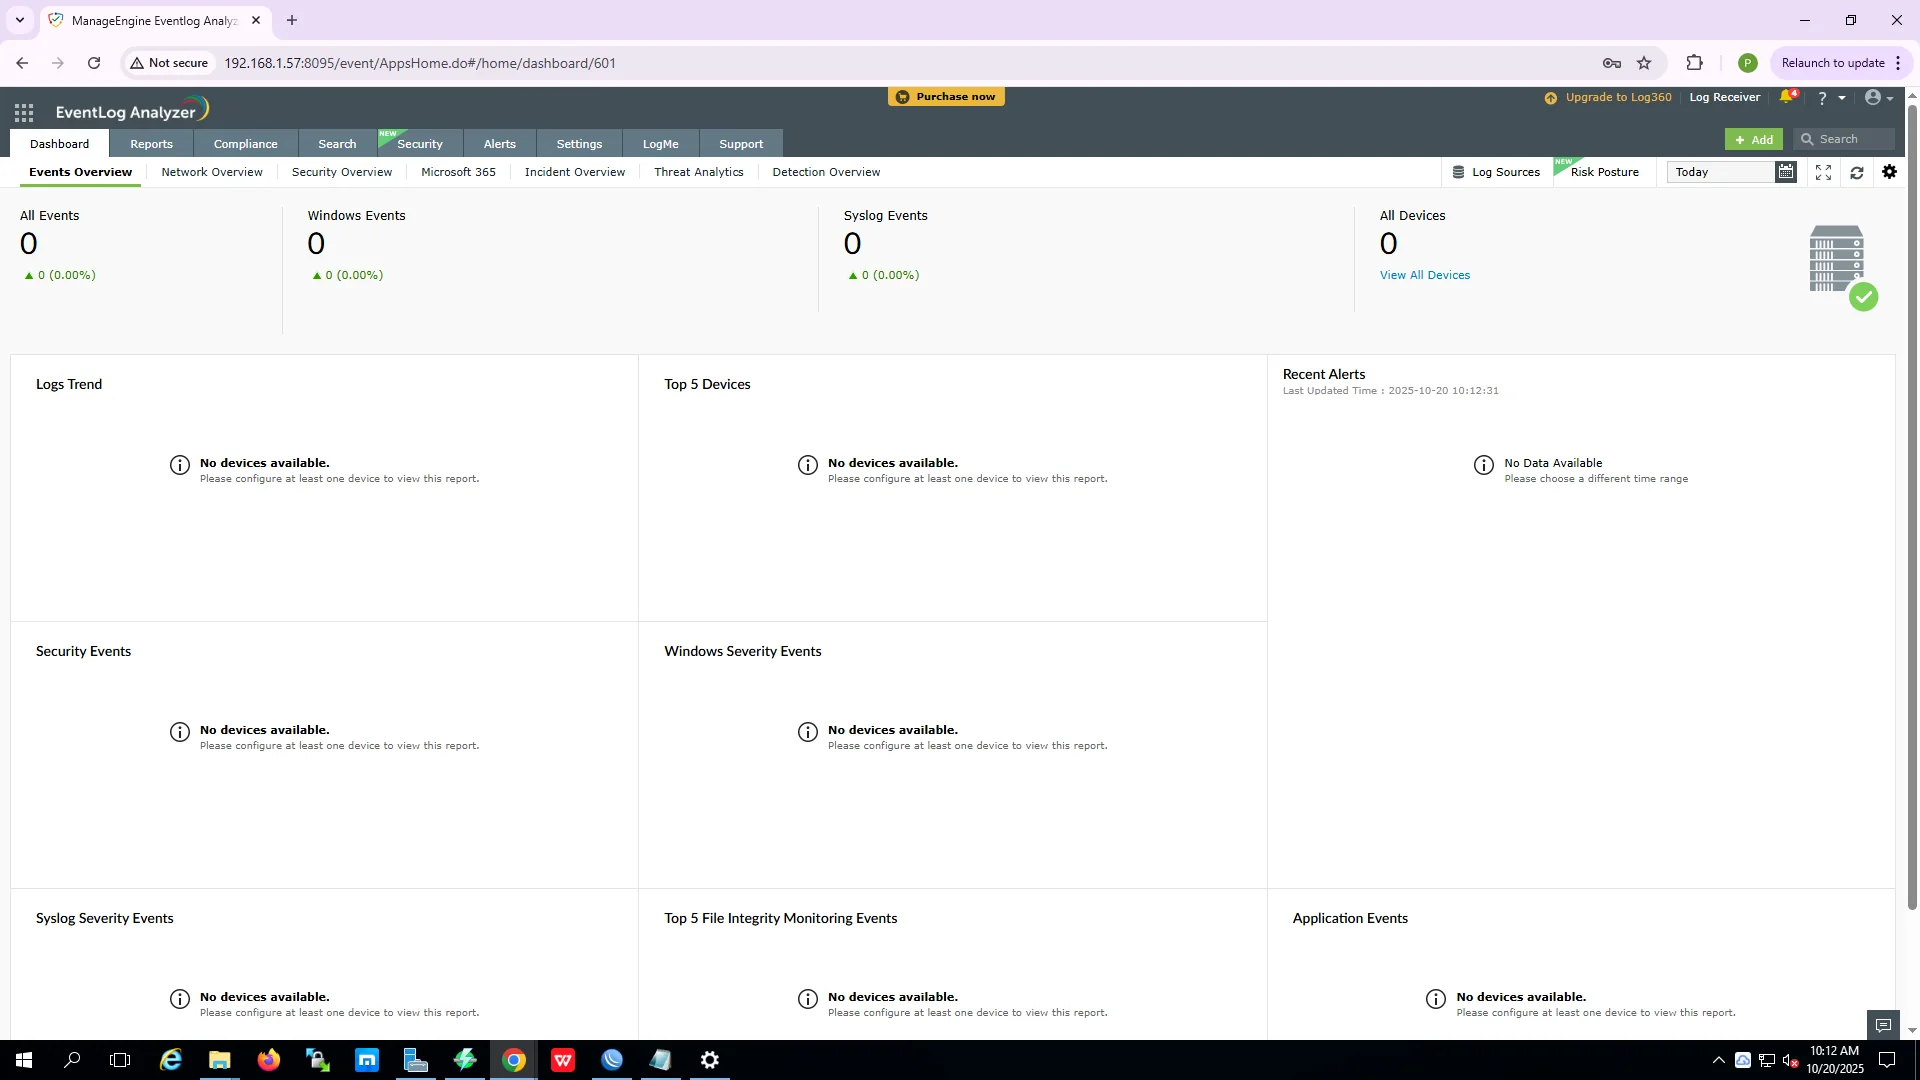
The install experience is the smoothest of the four. Single binary, handles everything. The trade-off is opacity: you configure ELA as a unit, not individual components.
Graylog
Graylog needs three components in order: MongoDB (metadata), OpenSearch (log indexing and query), and Graylog itself.
MongoDB:
# Import signing key
curl -fsSL https://pgp.mongodb.com/server-7.0.asc | \
  sudo gpg -o /usr/share/keyrings/mongodb-server-7.0.gpg --dearmor

# Add MongoDB 7.0 repository for Debian 12
echo "deb [ signed-by=/usr/share/keyrings/mongodb-server-7.0.gpg ] \
  http://repo.mongodb.org/apt/debian bookworm/mongodb-org/7.0 main" | \
  sudo tee /etc/apt/sources.list.d/mongodb-org-7.0.list

sudo apt-get update
sudo apt-get install -y mongodb-org
sudo apt-mark hold mongodb-org  # pin the version
OpenSearch:
Graylog 6.x uses OpenSearch as its search backend, not Elasticsearch — they diverged and aren’t interchangeable here.
wget https://artifacts.opensearch.org/releases/bundle/opensearch/2.15.0/opensearch-2.15.0-linux-x64.tar.gz
tar -xzf opensearch-2.15.0-linux-x64.tar.gz
sudo mv opensearch-2.15.0 /usr/share/opensearch
sudo useradd -r opensearch
sudo chown -R opensearch:opensearch /usr/share/opensearch
Configure opensearch.yml to listen on port 9002 instead of the default 9200. Graylog expects 9002 — and if you leave it on 9200, you’ll have a port conflict if you ever want to run ELK on the same network.
Graylog:
wget https://packages.graylog2.org/repo/packages/graylog-6.3-repository_latest.deb
sudo dpkg -i graylog-6.3-repository_latest.deb
sudo apt-get update
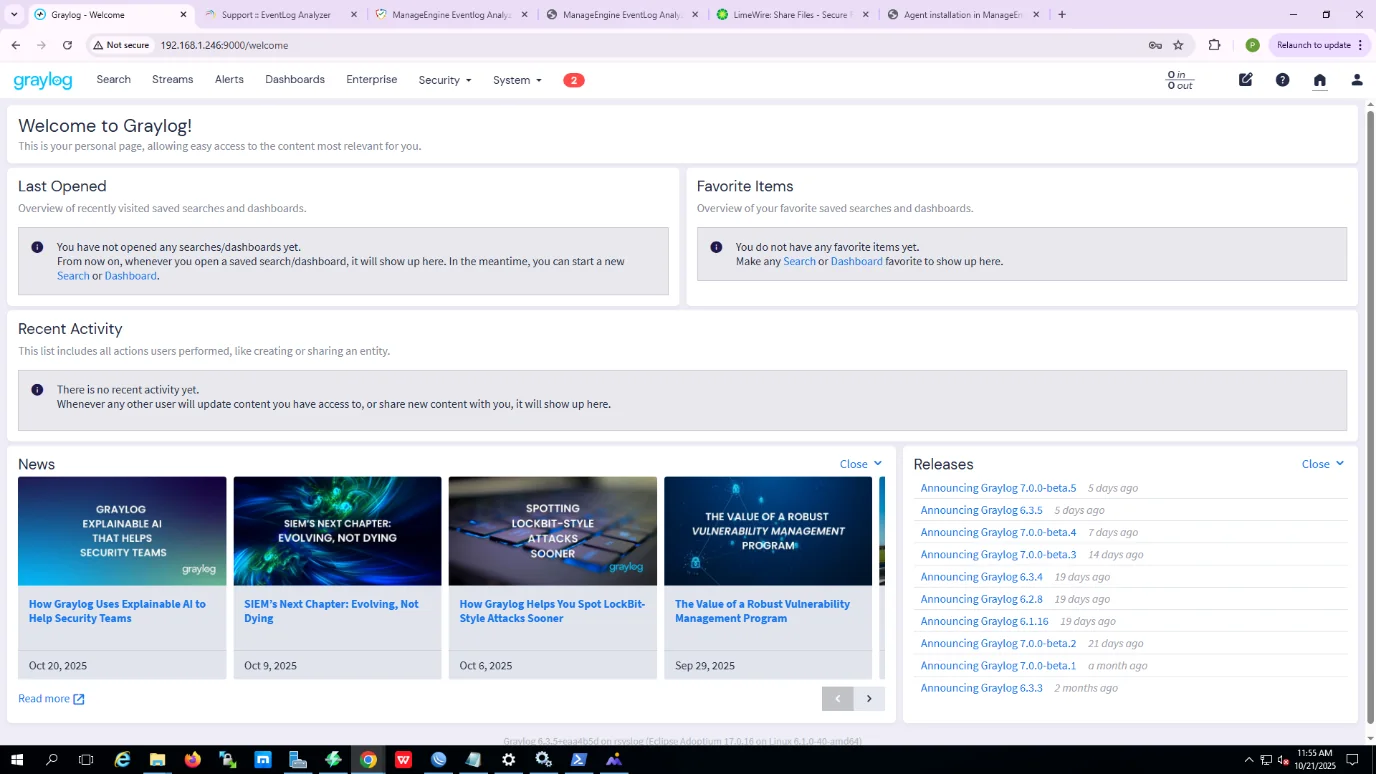
# install graylog-server, set password hash, configure server.confBefore opening the web UI, check the health endpoint. It should return "status": "green". If it’s yellow or red, OpenSearch or MongoDB isn’t reachable — check those first before proceeding.

ELK Stack
The install order is Elasticsearch → Logstash → Kibana. All three come from Elastic’s APT repository.
Elasticsearch:
wget -qO - https://artifacts.elastic.co/GPG-KEY-elasticsearch | sudo apt-key add -
echo "deb https://artifacts.elastic.co/packages/8.x/apt stable main" | \
  sudo tee /etc/apt/sources.list.d/elastic-8.x.list
sudo apt update
sudo apt install elasticsearch -y
sudo systemctl enable elasticsearch
sudo systemctl start elasticsearch
When Elasticsearch first starts, it prints a password for the elastic user to stdout. Capture that — you won’t see it again. You’ll need it for both Logstash and Kibana.
Logstash:
sudo apt install logstash -y
sudo systemctl enable logstash
sudo systemctl start logstash
Before declaring it working, create a test pipeline to verify end-to-end connectivity to Elasticsearch:
input {
  stdin {}
}
output {
  elasticsearch {
    hosts => ["https://localhost:9200"]
    user => "elastic"
    password => "[elastic-password]"
    ssl_certificate_verification => false
    index => "test-log-%{+YYYY.MM.dd}"
  }
  stdout { codec => rubydebug }
}
Run this manually, type something into stdin, and check if the test-log-* index appears in Elasticsearch. If it does, the pipeline is working.
Kibana:
sudo apt install kibana -y
sudo nano /etc/kibana/kibana.yml  # set elasticsearch.password
sudo systemctl enable kibana
sudo systemctl start kibana
Kibana needs its own kibana_system credential — reset it separately:
sudo /usr/share/elasticsearch/bin/elasticsearch-reset-password -u kibana_systemUpdate kibana.yml with the new password, restart, and the dashboard comes up on port 5601.
Grafana Loki
Loki is the lightest install — no separate database, no external indexer. Just a binary and a config file.
Loki:
wget https://github.com/grafana/loki/releases/latest/download/loki-linux-amd64.zip
unzip loki-linux-amd64.zip
sudo mv loki-linux-amd64 /usr/local/bin/loki
sudo chmod +x /usr/local/bin/loki
Write a config.yml, register it as a systemd service, then verify it’s ready:
curl http://localhost:3100/ready
# expected: ready
Promtail (the log shipper):
cd /tmp
wget https://github.com/grafana/loki/releases/latest/download/promtail-linux-amd64.zip
unzip promtail-linux-amd64.zip
sudo mv promtail-linux-amd64 /usr/local/bin/promtail
sudo chmod +x /usr/local/bin/promtail
Grafana:
wget -q -O - https://packages.grafana.com/gpg.key | sudo apt-key add -
echo "deb https://packages.grafana.com/oss/deb stable main" | \
sudo tee /etc/apt/sources.list.d/grafana.list
sudo apt-get update
sudo apt-get install -y grafana
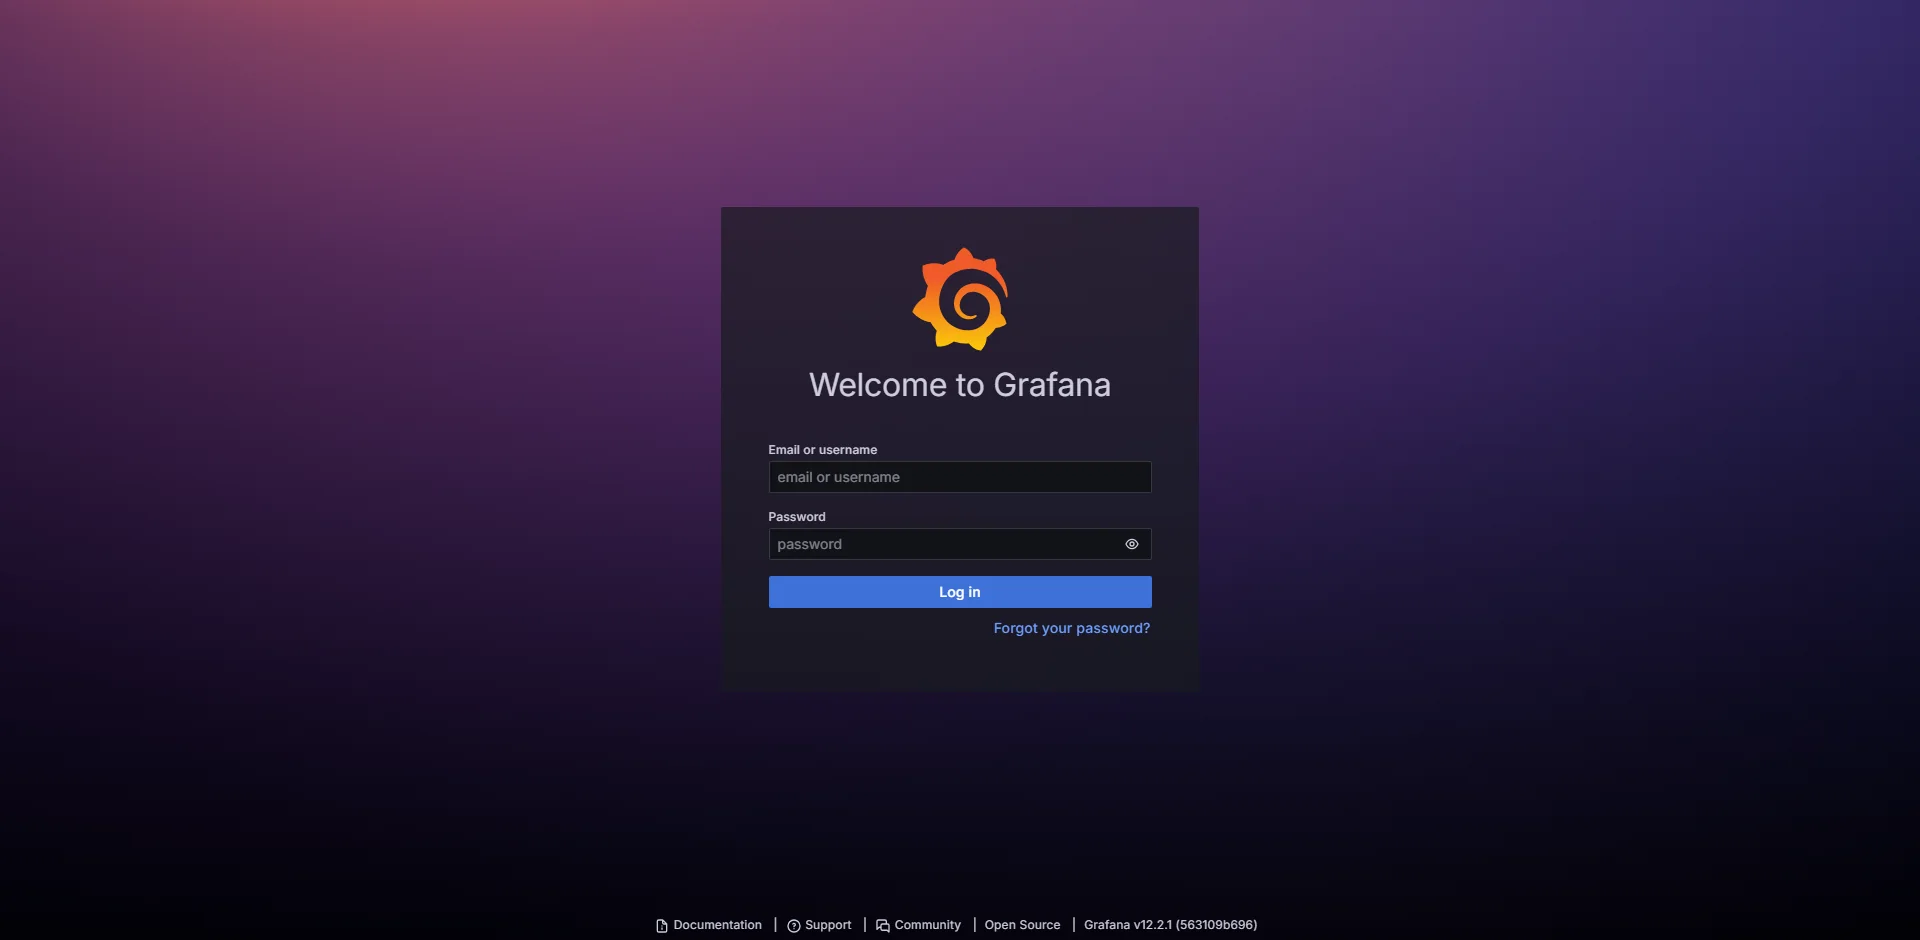
sudo systemctl enable grafana-server --nowGrafana runs on port 3000. Add Loki as a data source once it’s up.
Log Source Configuration
With all four platforms running, the next step was connecting the actual log sources — local server syslog, inter-server forwarding, and the Palo Alto firewall.
ManageEngine ELA
Local agent logs are picked up automatically after install — no manual configuration needed. That’s a genuine advantage for getting started fast.
For syslog from external devices, go to Settings → Devices → Syslog Devices → Add Devices and fill in the device IP and protocol (UDP 514 for the firewall). Web server logs go through Settings → Import Logs with the server address and credentials.
Graylog
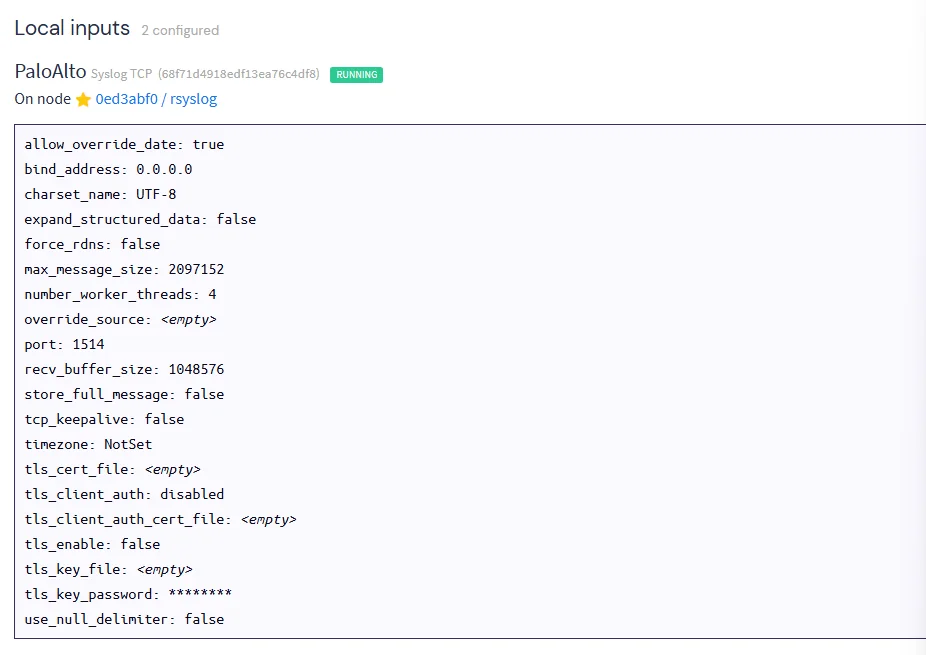
Graylog ingests logs through “Inputs”. Go to System → Inputs, select Syslog TCP, click Launch Input, set bind address and port. That becomes the listening endpoint for any device sending syslog.
For the Palo Alto firewall logs, they go through an rsyslog relay first. The relay filters by source IP and writes to a dedicated file, then Graylog’s syslog input picks them up. The input config after it’s running:
ELK Stack
ELK ingestion goes through Logstash pipelines. For inter-server log forwarding, configure rsyslog on the source machine to forward over TCP:
# /etc/rsyslog.d/90-forward.conf (on source server)
*.* @@[receiver-ip]:514
On the receiver, filter by source IP and write to a dedicated file:
if ($fromhost-ip == '[source-ip]') then {
action(
type="omfile"
file="/var/log/rsyslog/[source-ip].log"
createDirs="on"
FileCreateMode="0640"
)
stop
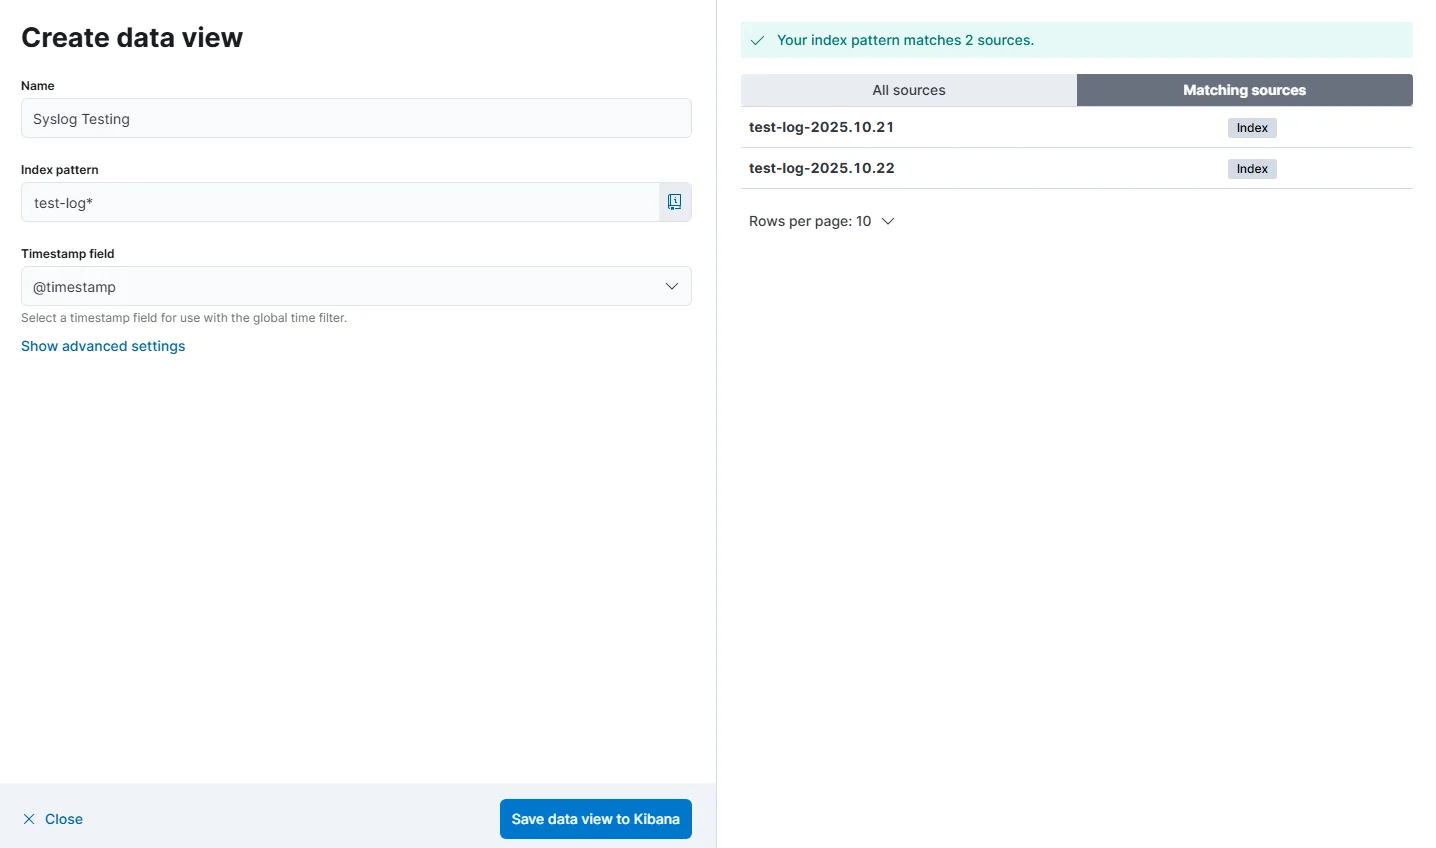
}Then create a Logstash pipeline that tails that file, parses it with grok, and pushes to Elasticsearch. In Kibana, create a matching Data View under Management → Stack Management → Data Views with the index pattern and @timestamp field:
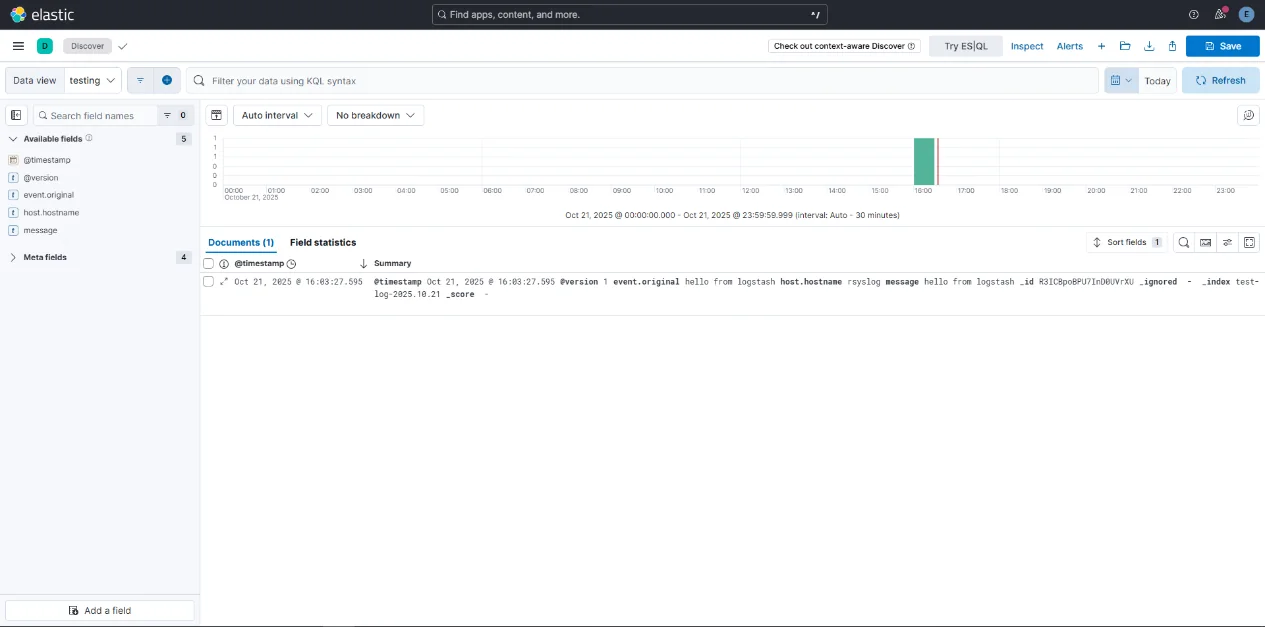
Once the Data View is saved, logs appear immediately in Discover:
Grafana Loki
Update Loki’s config.yml to set http_listen_address: 0.0.0.0 so it accepts connections from other hosts, then verify:
curl http://localhost:3100/ready
# ready
Configure Promtail to tail the relevant log files and push to Loki’s HTTP endpoint. Add Loki as a data source in Grafana and logs start appearing in the Explore view.
Phase 2 Result
All four platforms confirmed log ingestion.
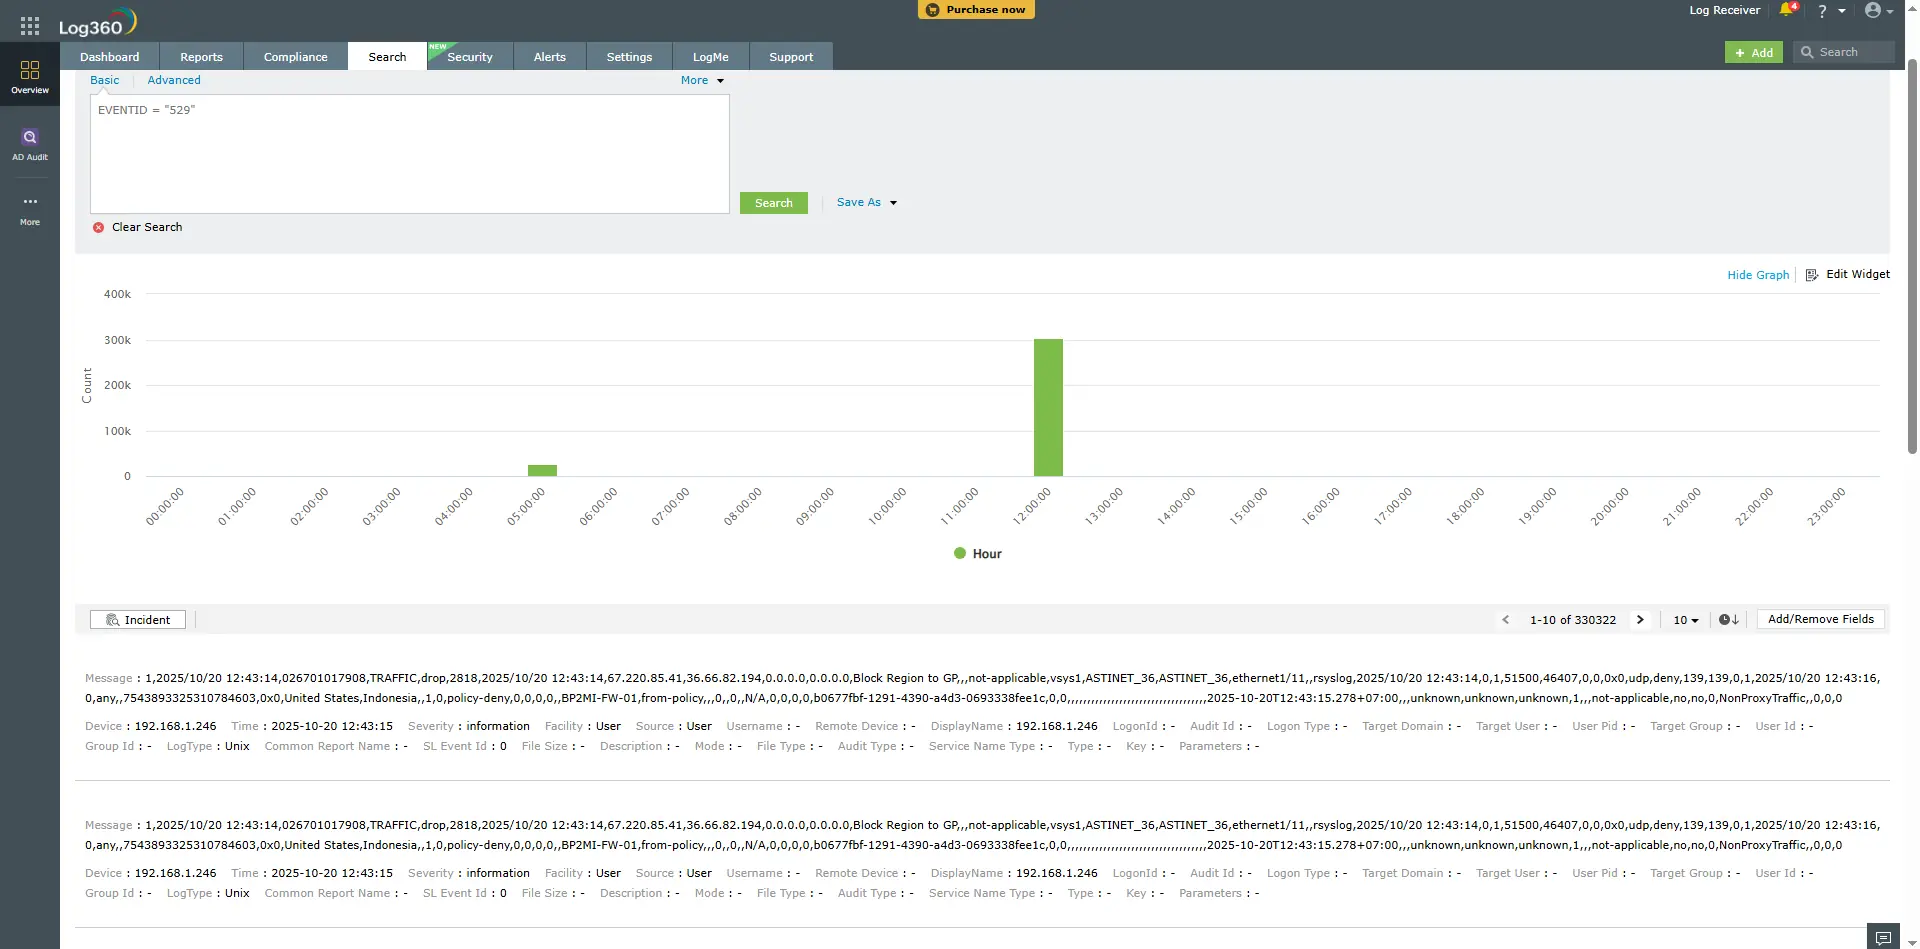
ManageEngine ELA — 330,000+ events visible in Search, including Palo Alto firewall traffic logs:
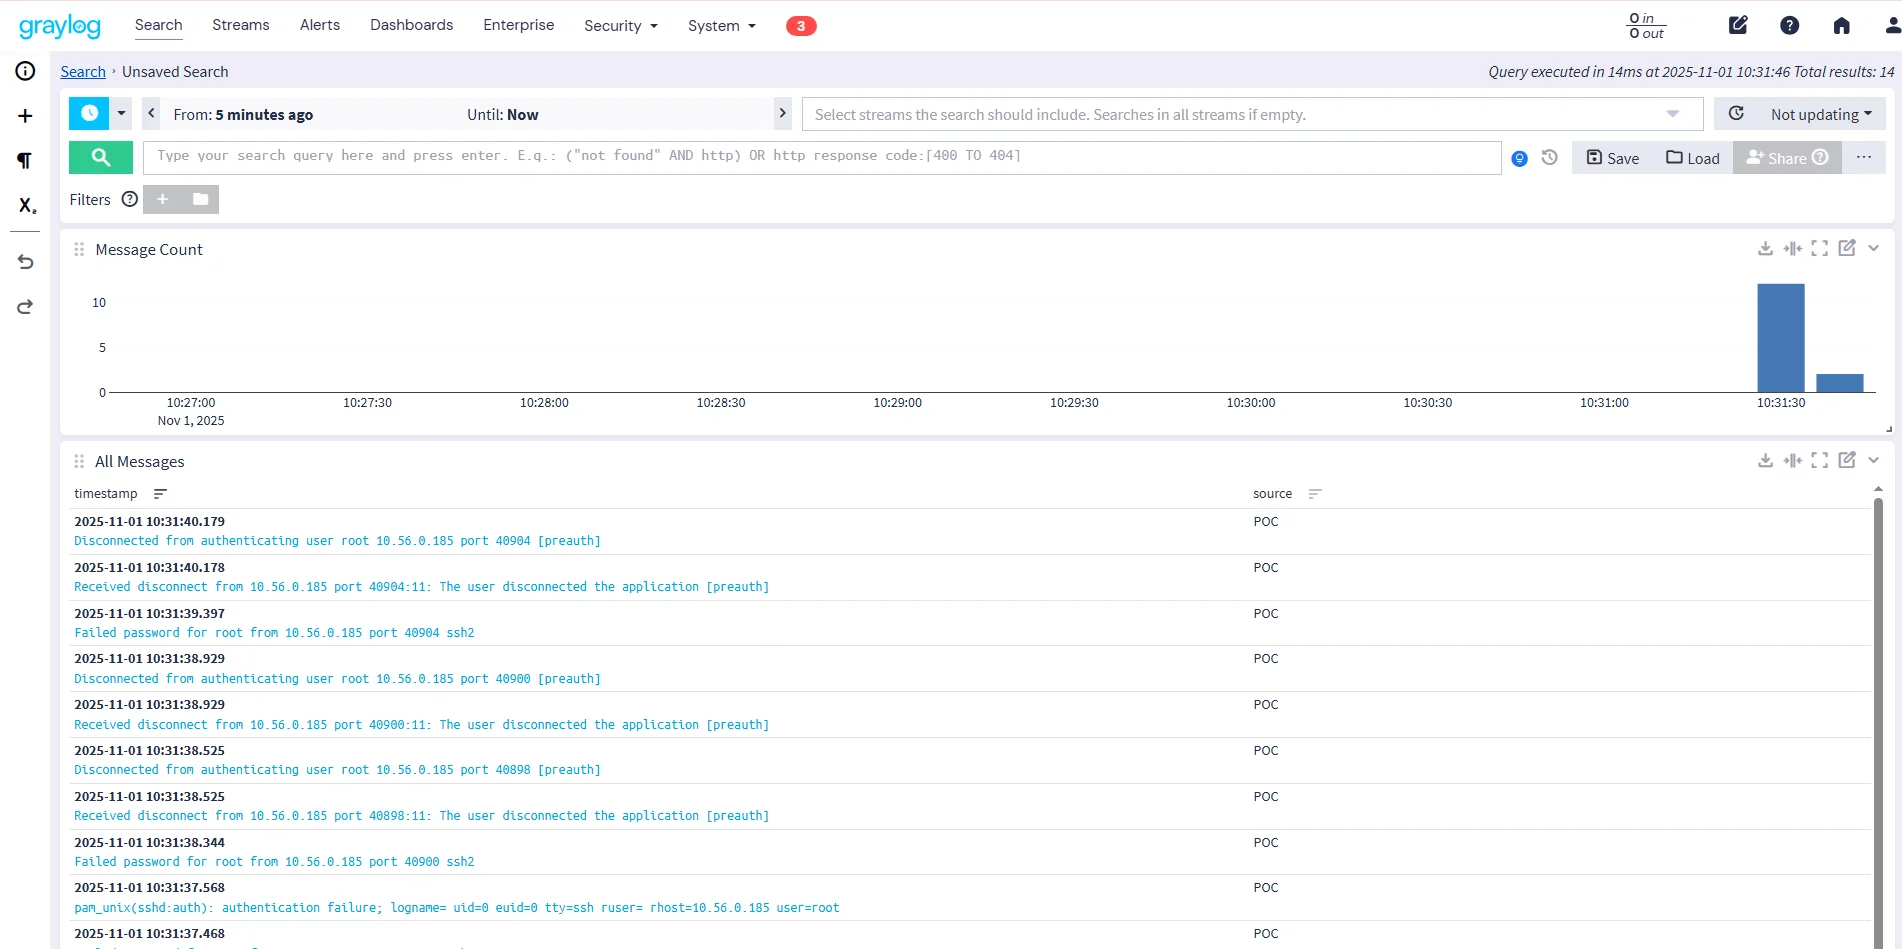
Graylog — syslog input live, SSH authentication events appearing in real time:
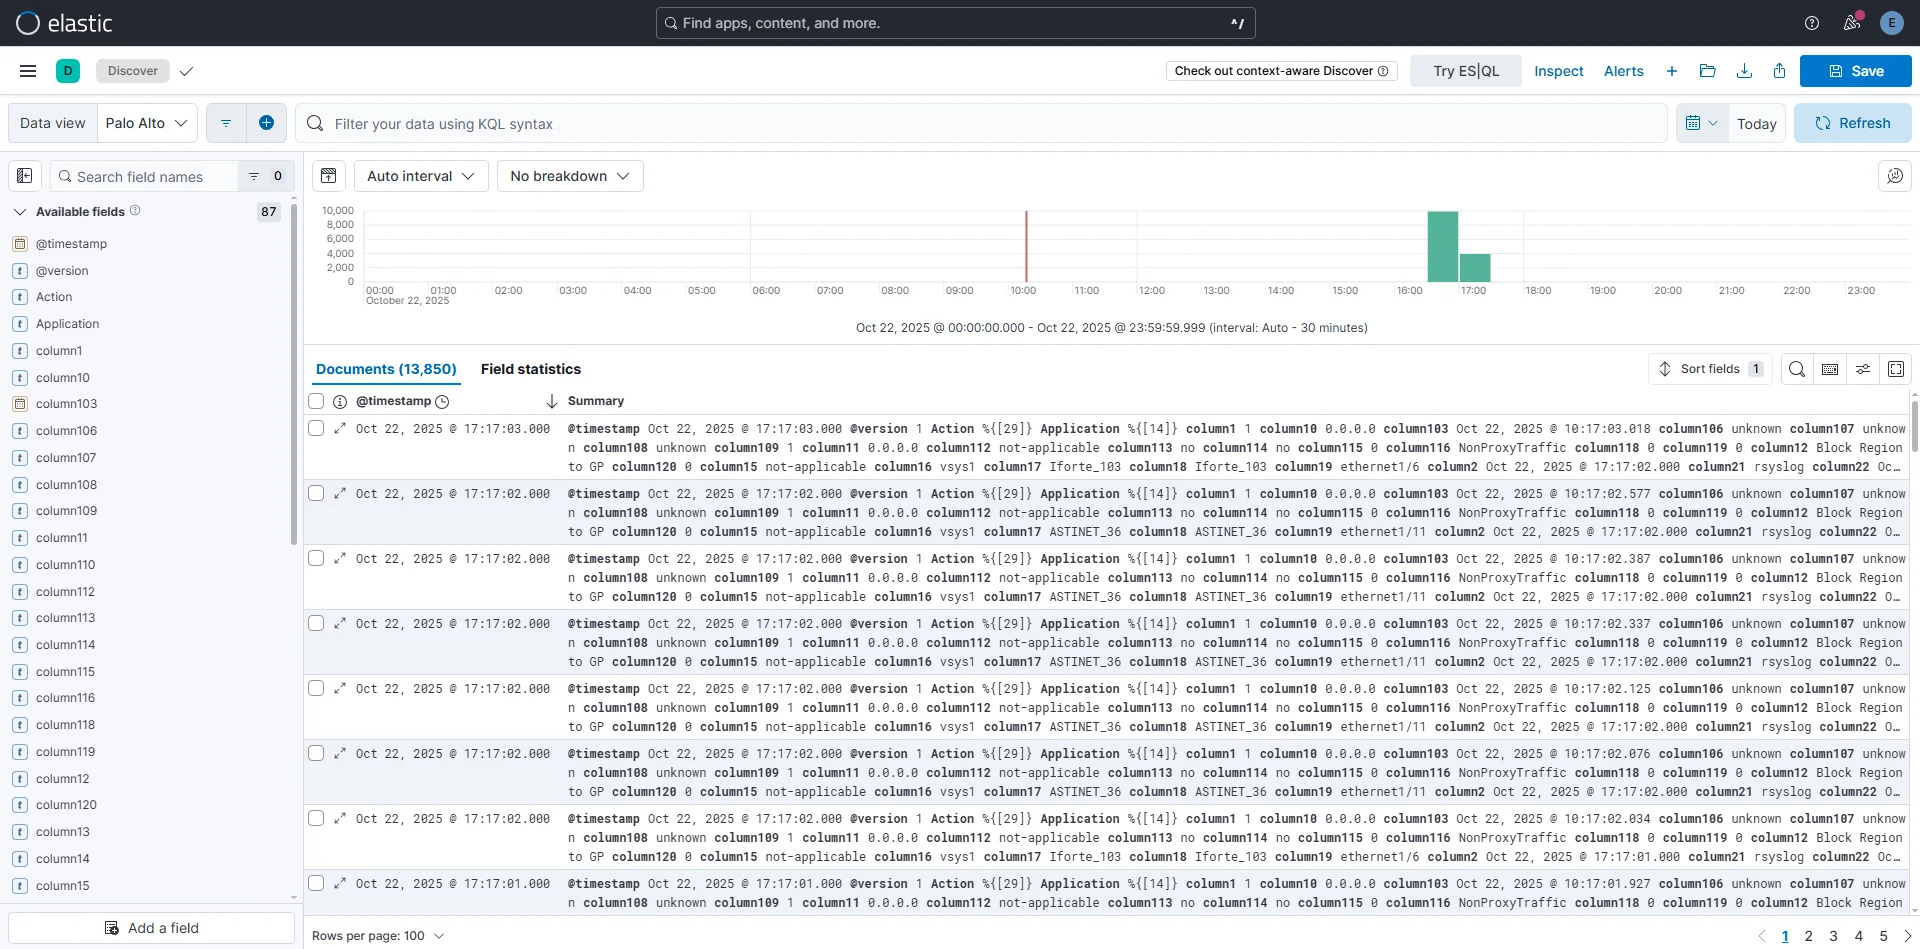
ELK Stack — 13,850 Palo Alto documents indexed and visible in Kibana Discover:
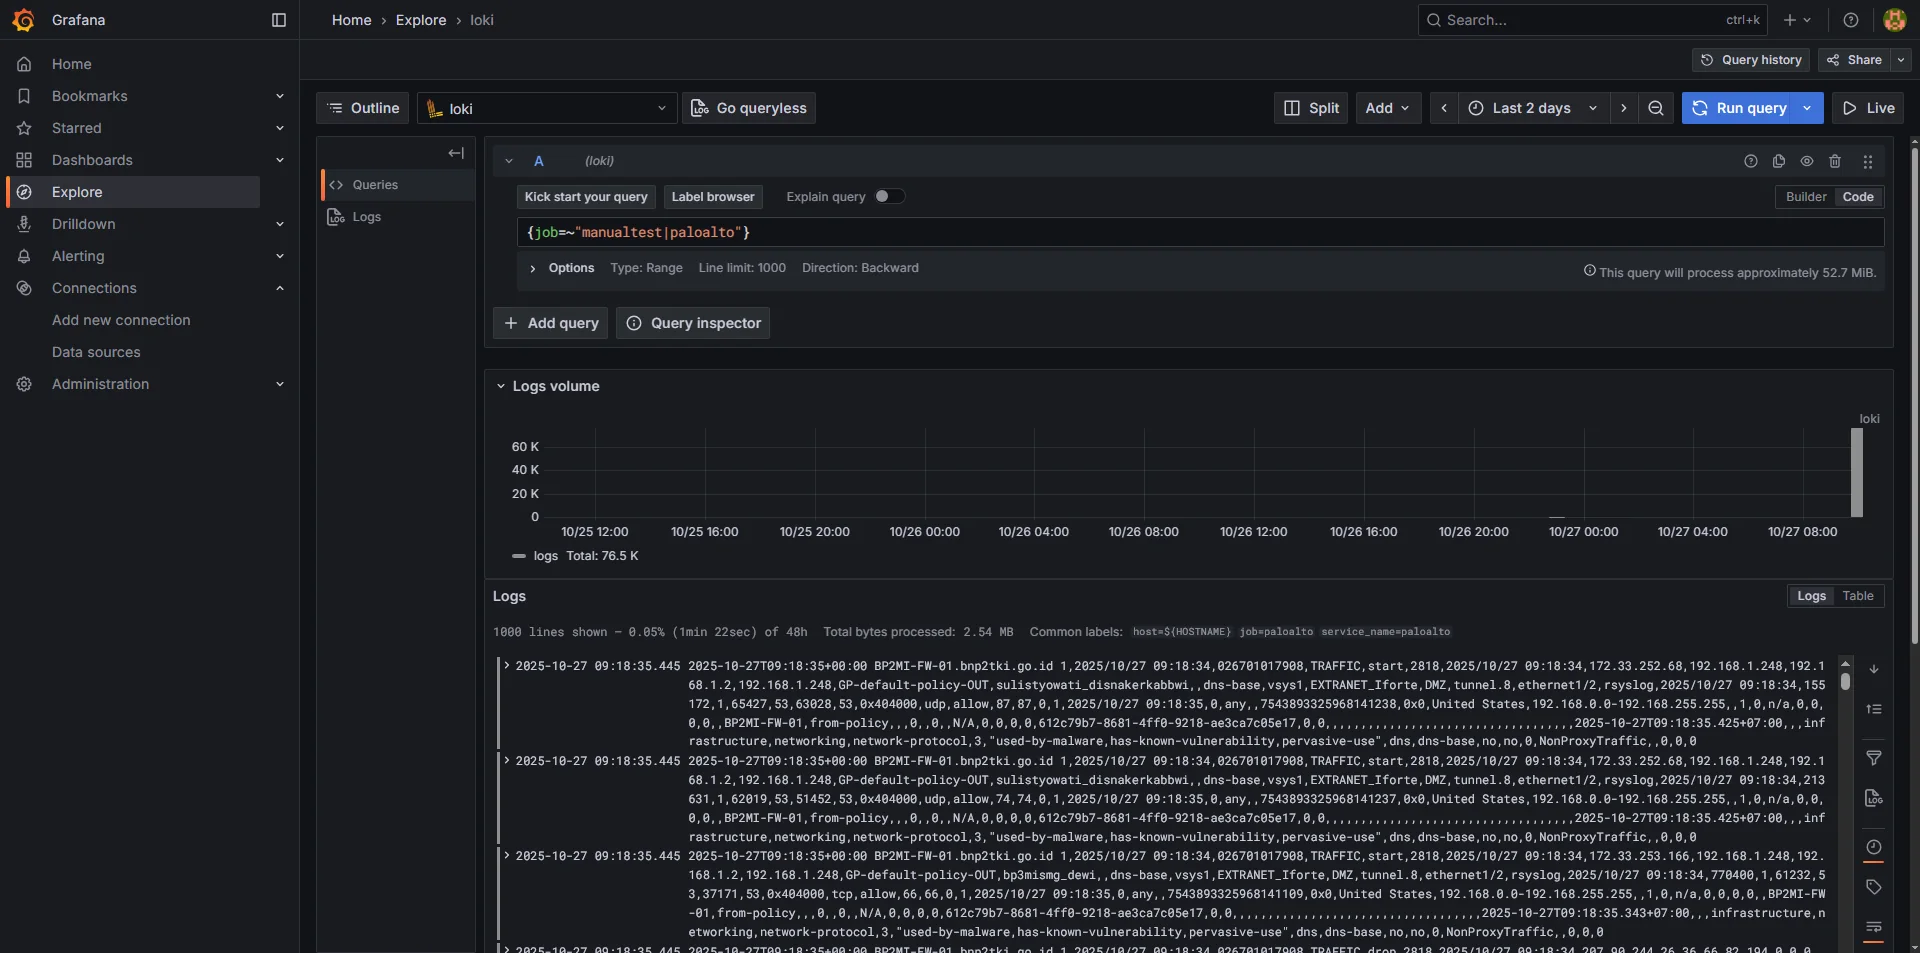
Grafana Loki — 76.5K log lines from the firewall visible in Explore via LogQL:
No tool failed at basic ingestion. The “log received” milestone was met across the board. What differed was how each tool structured and surfaced those logs — and that’s what Phase 3 digs into.
Part 2 of 4. Part 1 covered planning and specification. Part 3 will cover integration testing and security simulation.